What Makes Debt Mutual Funds Score Over Fixed Deposits? Find Out Now.
Last Updated : March 6, 2020, 2:34 p.m.
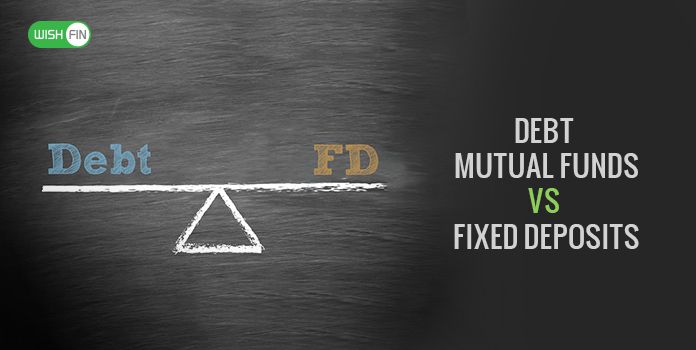
When it comes to choosing a safe investment, fixed deposits remain the choice of many. But when it is about capital safety with better returns, debt mutual funds, a type of mutual fund that invests in safe instruments, dethrone fixed deposits and grab the number one spot. What’s more significant is the fact that they provide a greater degree of liquidity, making it a win-win situation for the investors.
Top Debt Mutual Funds vs Best Fixed Deposits
| Debt Mutual Funds | Return | Fixed Deposits | Interest Rate |
|---|---|---|---|
| Baroda Pioneer Credit Opportunities Fund - Plan A | 10.50% | State Bank of India | 3.75%-7% |
| Birla Sun Life Corporate Bond Fund | 9.65% | ICICI Bank | 4%-7% |
| ICICI Prudential Gift Fund Investment Plan PF Option | 9.38% | HDFC Bank | 3.50%-7% |
Note – MF return data is obtained from Value Research, while FD rates are taken from the website of respective banks.
Calculation of Estimated Earnings on FD and Debt MF
Let’s compare the earnings of debt mutual funds and fixed deposits on a 3-year period for different amounts of deposit/investment. Assume 9% return for debt MFs and 6% interest rate for FDs.
Debt MFs vs FDs on Amount Worth ₹1 Lakh
| Points | Debt Mutual Funds | Fixed Deposits |
|---|---|---|
| Return/Interest | 9% | 6% |
| Investment/Deposit Value at the End of 3 Years | ₹1,27,000 | ₹1,18,000 |
| Gains to be Made | ₹27,000 | ₹18,000 |
| Debt MF Outscores FD by ₹9,000 (27,000-18,000) Difference Between Debt MF and FD Earnings = 50% | ||
Debt MFs vs FDs on Amount Worth ₹3 Lakh
| Points | Debt Mutual Funds | Fixed Deposits |
|---|---|---|
| Return/Interest | 9% | 6% |
| Investment/Deposit Value at the End of 3 Years | ₹3,81,000 | ₹3,54,000 |
| Gains to be Made | ₹81,000 | ₹54,000 |
| Debt MF Outscores FD by ₹27,000 (81,000-54,000) Difference Between Debt MF and FD Earnings = 50% | ||
Debt MFs vs FDs on Amount Worth ₹5 Lakh
| Points | Debt Mutual Funds | Fixed Deposits |
|---|---|---|
| Return/Interest | 9% | 6% |
| Investment/Deposit Value at the End of 3 Years | ₹6,35,000 | ₹5,90,000 |
| Gains to be Made | ₹1,35,000 | ₹90,000 |
| Debt MF Outscores FD by ₹45,000 (1,35,000-90,000) Difference Between Debt MF and FD Earnings = 50% | ||
As you see, the debt mutual fund investors are likely to take a 50% lead over their fixed deposit counterparts. So, let’s invest in the best debt funds.
Tax Implication of Debt MFs & FDs at a Glance
| Points | Debt Mutual Funds | Fixed Deposits |
|---|---|---|
| Tax Deducted at Source (TDS) | No, it doesn’t apply here and so would lead to more savings. | 10% TDS charged every year if submitted the PAN. in the absence of the same, 20% TDS will apply. |
| Basis of Tax Implication | Tax charged on capital gains. | Tax charged on interest income |
| Benefit of Indexation | Indexation Benefit is available to lower down the tax liability. | Unfortunately, FDs do not provide such benefits |
How Can Indexation Help Debt MF Investors Reduce Their Tax Liability?
An indexation is a tool that helps debt mutual fund investors score over fixed deposit customers in terms of tax liability. The tool helps adjust the purchase price according to the inflation and hence reduce the tax considerably. Let’s take an example and check out the role of indexation in curbing the tax liability of an investor.
Example – Shyam Bansal invested ₹5 lakhs in a debt fund on April 14, 2011. And on June 26, 2014, he sold the investments for ₹6.70 lakhs. The gain of ₹1.70 lakhs (before indexation) made by Shyam would be considered as a long-term capital gain (LTCG) as the sale is made after three years of holding the assets. And hence, he will get the benefit of indexation.
At first, we need to calculate the indexed cost of purchase. For that, we should know the cost inflation index (CII) of two financial years – the financial year in which the units are bought and the year in which they are sold.
CII Table
| Financial Year | CII |
|---|---|
| 2000-01 | 406 |
| 2001-02 | 426 |
| 2002-03 | 447 |
| 2003-04 | 463 |
| 2004-05 | 480 |
| 2005-06 | 497 |
| 2006-07 | 519 |
| 2007-08 | 551 |
| 2008-09 | 582 |
| 2009-10 | 632 |
| 2010-11 | 711 |
| 2011-12 | 785 |
| 2012-13 | 852 |
| 2013-14 | 939 |
| 2014-15 | 1024 |
| 2015-16 | 1081 |
| 2016-17 | 1125 |
While glancing at the CII table, you will find the CII of FY 2011-12 and FY 2014-15 to be 785 and 1024, respectively.
The inflated purchase price will thus be calculated as per the following formula.
Indexed cost = CII of the Year of Sale/CII of the Year of Purchase x 5,00,000
= 1024/785 x 5,00,000 = ₹6,52,230 (approx.)
Therefore, your LTCG after indexation equals to ₹17,770 (6,70,000-6,52,230).
Tax on LTCG before indexation would have been 20% of 1,70,000 =₹34,000
Tax on LTCG After indexation comes down to ₹3,554 (20% of 17,770)
So, you can see a tax reduction of ₹30,446 (34,000-3,554) with indexation in place.
Disclaimer- Mutual Fund Investments are subject to market risks. Please read the scheme related documents carefully before investing.